Menu Explore
Tutorials
Surrogate Exploration |
|
Uncertainty Propagation |
|
Sensitivity Analysis |
|

Architecture

Explore Model
exploreModel.R
source("modules/menuExplore/exploreModel/modelQualitativeExploration.R", local = TRUE)
source("modules/menuExplore/exploreModel/modelQuantitativeExploration.R", local = TRUE)
source("modules/menuExplore/exploreModel/modelManualExploration.R", local = TRUE)
UI and Server functions
- exploreModel.ui(id)
This function creates the Exploration with Surrogate Model page with three panels:
Qualitative Exploration
Quantitative Exploration
Manual Exploration
- Parameters:
id (character) – namespace of the module
Main reactives:
Calls
modelQualitativeExploration.ui()with id modelQualitativeExplorationCalls
modelQuantitativeExploration.ui()with id modelQuantitativeExplorationCalls
modelManualExploration.ui()with id modelManualExploration
- exploreModel.server(input, output, session, DOE, listmodels, window.dimension, settings)
- Parameters:
input (list-like-object) – stores the widgets’ values.
output (list-like-object) – stores the instructions to build R objects in the app.
session (object) – environment that can be used to access information and functionality relating to the session.
DOE (object) – stores the point values and the DOE information (e.g. bounds…)
listmodels (list) – list of trained models
window.dimension (object) – dimensions of the window
settings (list-like-object) – variables specified in settingsExploration.R
Main reactives:
Calls
modelQualitativeExploration.server()with id modelQualitativeExplorationCalls
modelQuantitativeExploration.server()with id modelQuantitativeExplorationCalls
modelManualExploration.server()with id modelManualExploration
modelQualitativeExploration.R
UI and Server functions
- modelQualitativeExploration.ui(id)
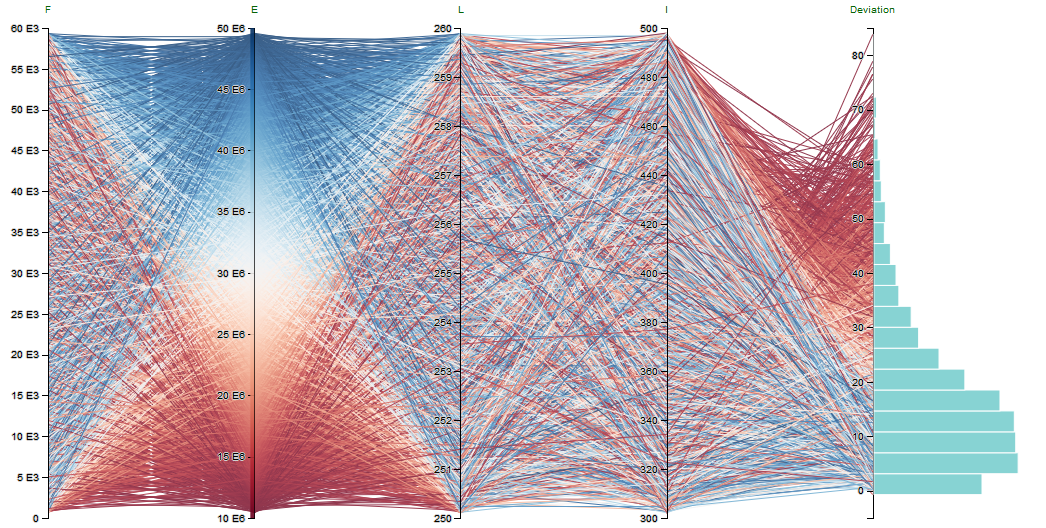
This function populates the Qualitative Exploration panel, which mainly displays a parallel coordinate plot
- Parameters:
id (character) – namespace of the module
Main reactives:
keepbounds: switch to keep bounds
choose.palette.num: color palette selection for numerical variables
choose.palette.cat: color palette selection for categorical variables
downloadpcp: button to export parallel plot
chooseX: input variable selection
chooseY: output variable selection
chooseHistParcoords: variable selection for which a histogram will be displayed
chooseBoundsParcoords: bound selection for variables
Loadsampling: button to load a sampling from file
bounds: button to refine sampling
SMCsettings: button to perform inverse sampling
parcoords: displays parallel plot
dataView: displays data as a table
- modelQualitativeExploration.server(input, output, session, DOE, listmodels, window.dimension, settings)
- Parameters:
input (list-like-object) – stores the widgets’ values.
output (list-like-object) – stores the instructions to build R objects in the app.
session (object) – environment that can be used to access information and functionality relating to the session.
DOE (object) – stores the point values and the DOE information (e.g. bounds…)
listmodels (list) – list of trained models
window.dimension (object) – dimensions of the window
settings (list-like-object) – variables specified in settingsExploration.R
Main reactives:
choicesX: input variable list
selectedX: selected input variables
choicesY: output variable list
selectedY: selected output variables
choicesHistParcoords: list of variables for which to display a histogram
choicesBoundsParcoords: list of variables for which to update bounds
parcoordsData: data generated by
getParcoordsData()orgetParcoordsDataFromFile()selectedParCoords: data.frame filtered out by user selection
dataPCP: object that contains the data and every information for the plot
output$parcoords: renders parallel plot
output$brushed: builds data table with filtered out by user selection
output$download: downloadable CSV file containing brushed data
output$downloadpcp: Downloadable html of parallelPlot
output$dataView: displays brushed data table
Main functions
- getParcoordsData(DOE, nobs, predfunc, Xinfos, Yinfos, callback)
Generates input data using
sampleInputs()and computes output data for the parallel plot using the selected metamodel- Parameters:
DOE (object) – stores the point values and the DOE information (e.g. bounds…)
nobs (numeric) – number of observations expected
predfunc (function) – computes prediction with the selected metamodels
Xinfos (object) – input variable information
Yinfos (object) – output variable information
callback (function) – reports progress
- getParcoordsDataFromFile(DOE, PCPsample, predfunc, Yinfos, callback)
Same as
getParcoordsData()but gets the input data from a file- Parameters:
DOE (object) – stores the point values and the DOE information (e.g. bounds…)
PCPsample (data.frame) – input sample
predfunc (function) – computes prediction with the selected metamodel
Yinfos (object) – output variable information
callback (function) – reports progress
Secondary functions
- sampleInputs(DOE, nobs, Xinfos)
Generates a sample of data
- Parameters:
DOE (object) – stores the point values and the DOE information (e.g. bounds…)
nobs (numeric) – number of observations expected
Xinfos (object) – input variable information
- unrestricted(N, range)
Generates a random composition with a uniform distribution [3]
- Parameters:
N (numeric) – number of datasets to be simulated
range (matrix) – number of parts
- logpost_vec(sample, nu_t, constraint)
Computes log-posterior, performs a smoothing of the indicator function [3]
- Parameters:
sample (vector) – sample
nu_t (numeric) – smoothing parameter
constraint (function) – constraint function
- Gibbs_vec(x, q, d, nu_t, lpdent = lpdent, N, constraint)
Computes Gibbs sampling, performs a random disturbance on the sample [3]
- Parameters:
x (vector) – sample
q (numeric) – variance of the gaussian that disturbs each dimension
d (numeric) – dimension index to disturb
nu_t (numeric) – smoothing parameter
lpdent (function) –
logpost_vec()function before diturbance, in order to compare after the disturbance. It helps decide whether to accept the disturbance or not.N (numeric) – sample size
constraint (function) – constraint function
- adapt_seq_vec(nu, nu0, t, N, term=term, Wt, constraint)
Performs adaptive specification of the constraint parameter. It chooses the next smoothing parameter by keeping a value of the Effective Samle Size (ESS) higher or equal to 1/2. [3]
- Parameters:
nu (numeric) – smoothing parameter
nu0 (numeric) – previous smoothing parameter
t (numeric)
N (numeric) – sample size
term (numeric) – evaluated sample constraint
Wt (numeric) – weights of the particles
constraint (function) – constraint function
- get.constraintfunction(dfparcoords, DOE, Xinfos, predfunc)
Returns constraint function
- Parameters:
dfparcoords (data.frame) – contains data for the parallel plot
DOE (object) – stores the point values and the DOE information (e.g. bounds…)
Xinfos (object) – input variable information
predfunc (function) – computes prediction with the selected metamodels
- get.lowerupper(dfparcoords, DOE, Xinfos)
Returns lower and upper bounds
- Parameters:
dfparcoords (data.frame) – contains data for the parallel plot
DOE (object) – stores the point values and the DOE information (e.g. bounds…)
Xinfos (object) – input variable information
- SCMC_withcallback(dfparcoords, DOE, Xinfos, predfunc, nsampleSMC, iterSMC, callback)
Computes inverse sampling [3]
- Parameters:
dfparcoords (data.frame) – contains data for the parallel plot
DOE (object) – stores the point values and the DOE information (e.g. bounds…)
Xinfos (object) – input variable information
predfunc (function) – computes prediction with the selected metamodel
nsampleSMC (numeric) – number of observations
iterSMC (numeric) – number of iterations
callback (function) – reports progress
- callback(i)__
Reports progress of a task. Calls R Shiny incProgress
- Parameters:
i (numeric) – ith iteration
modelQuantitativeExploration.R
source("modules/shared/dynamicSelect.R", local = TRUE)
source("modules/shared/dynamicSelect.R", local = TRUE)
source("modules/menuExplore/exploreModel/modelQualitativeExploration.R", local = TRUE)
UI and Server functions
- modelQuantitativeExploration.ui(id)
This function populates the Quantitative Exploration panel with three tabs
- Parameters:
id (character) – namespace of the module
Main reactives:
Regression plot - One by One
Regression plot using one or two input variables against one output variable. The values of the unused input variables is set by the user with the sliders. This way, we see the effect of the choosen input(s) on the output with specific values for the other inputs.
chooseX1: input variable 1 selection
chooseX2: input variable 2 selection
chooseY: output variable selection
chooseVisu: plot type selection
sliders: slider to choose the value of the unselected input variables
plotExplo: displays plot
Regression plot with smoothing - All in One
Same as the first regression plot but the mean over all possible values is used for the other inputs instead of a specific value.
chooseYsmooth: output variable selection
chooseXsmooth: input variable selection
ui.treillis: lattice’s number of rows and columns / lattice navigation
ui.smooth: displays plot
Regression plot with smoothing - All in One (Summary)
Compares all the inputs in the same coordinate system with quantiles. It allows to visualize how the output reacts with every input.
chooseYsmoothsummary: output variable selection
chooseXsmoothsummary: input variable selection
ui.smooth.summary: displays plot
- modelQuantitativeExploration.server(input, output, session, DOE, listmodels, window.dimension, settings)
- Parameters:
input (list-like-object) – stores the widgets’ values.
output (list-like-object) – stores the instructions to build R objects in the app.
session (object) – environment that can be used to access information and functionality relating to the session.
DOE (object) – stores the point values and the DOE information (e.g. bounds…)
listmodels (list) – list of trained models
window.dimension (object) – dimensions of the window
settings (list-like-object) – variables specified in settingsExploration.R
Main reactives:
Regression plot - One by One
choicesX1: contains input variables names
choicesX2: contains input variables names
choicesY: contains output variables names
choicesVisu: contains plot types
output$sliders: displays sliders for value selection
remainingX: contains the unselected input variable names and values
output$plotExplo: displays plot
Regression plot with smoothing - All in One
chooseXsmooth: contains input variables names
chooseYsmooth: contains output variables names
goPrevious, goNext, goUp, goDown: buttons for lattice navigation
output$ui.treillis: displays lattice
output$plot.smooth: displays plot
Regression plot with smoothing - All in One (Summary)
xnamesmooth.summary: input variable selection
ynamesmooth.summary: output variable selection
output$plot.smooth.summary: displays plot
Plot functions
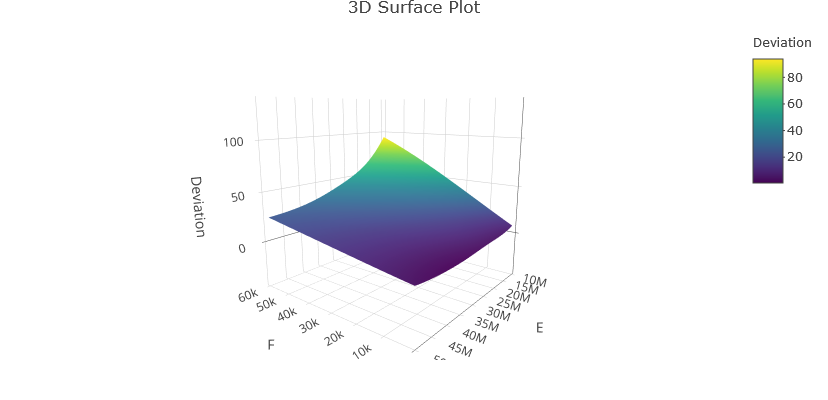
- plotExplo(DOE, predfun, yname, xname1, xname2, remainingX, ncontours, ftemp, visuname)
Plots either a regression plot, a contour plot, or a 3D suface plot
- Parameters:
DOE (object) – stores the point values and the DOE information (e.g. bounds…)
predfun (function) – selected metamodel predict function
yname (character) – output variable name
xname1 (character) – input variable name 1
xname2 (character) – input variable name 2
remainingX (list) – not selected input variable names and values
ncontours (numeric) – maximum number of contour levels
ftemp (numeric) – factor by which to shrink the range (see
getShrinkedRange())visuname (character) – type of plot (contour, 3D surface…)
Secondary functions
- getShrinkedRange(data, rangeFactor)
Shrinks the range by +/- range * rangeFactor
- Parameters:
data (vector) – data
rangeFactor (numeric) – factor by which the range should be shrinked
- callback(i)__
Reports progress of a task. Calls R Shiny incProgress
- Parameters:
i (numeric) – ith iteration
modelManualExploration.R
UI and Server functions
- modelManualExploration.ui(id)
This function populates the Manual Exploration panel
- Parameters:
id (character) – namespace of the module
Main reactives:
choice: radio buttons to choose whether to import a file with new data, or enter the data manually in the UI
proceed: button proceed with the choice
compute: button to compute predictions
download: button to export the predictions
content: table to display the data
- modelManualExploration.server(input, output, session, DOE, listmodels)
- Parameters:
input (list-like-object) – stores the widgets’ values.
output (list-like-object) – stores the instructions to build R objects in the app.
session (object) – environment that can be used to access information and functionality relating to the session.
DOE (object) – stores the point values and the DOE information (e.g. bounds…)
listmodels (list) – list of trained models
Main reactives:
dataAdd: contains the new data
input$save: gets new data from input
input$file$datapath: gets new data from file
input$compute: computes prediction for the new data
output$content: renders new data and predictions as a table
output$download: builds a CSV file to download data
Main functions
- get.newData.from.input(DOE, input, Yinfos)
Reads and shapes data from input file
- Parameters:
DOE (object) – stores the point values and the DOE information (e.g. bounds…)
input (list-like-object) – stores the widgets’ values.
Yinfos (object) – output variable information
- computeYpredForDataAdd(DOE, predfun, Xvalues, Yinfos)
Computes output prediction for new data
- Parameters:
DOE (object) – stores the point values and the DOE information (e.g. bounds…)
predfun (function) – selected metamodel predict function
Xvalues (matrix) – input variable values
Yinfos (object) – output variable information
UQ Model
UQModel.R
source("modules/menuExplore/UQModel/uncertaintyDefinition.R", local = TRUE)
source("modules/menuExplore/UQModel/uncertaintyPropagation.R", local = TRUE)
source("modules/menuExplore/UQModel/sensitivityAnalysis.R", local = TRUE)
UI and Server functions
- UQModel.ui(id)
This function creates the UQ & GSA with Surrogate Model page with three panels:
Step 1: Uncertainty Definition
Step 2: Uncertainty Propagation
Step 3: Sensitivity Analysis
- Parameters:
id (character) – namespace of the module
Main reactives:
Calls
uncertaintyDefinition.ui()with id uncertaintyDefinitionCalls
uncertaintyPropagation.ui()with id uncertaintyPropagationCalls
sensitivityAnalysis.ui()with id sensitivityAnalysis
- UQModel.server(input, output, session, DOE, ML, listmodels, use_simulator, window.dimension, settings)
- Parameters:
input (list-like-object) – stores the widgets’ values.
output (list-like-object) – stores the instructions to build R objects in the app.
session (object) – environment that can be used to access information and functionality relating to the session.
DOE (object) – stores the point values and the DOE information (e.g. bounds…)
ML (object) – quantitative exploration measures
listmodels (list) – list of trained models
use_simulator (logical) – informs if the user uses a simulator linked to Lagun
window.dimension (object) – dimensions of the window
settings (list-like-object) – variables specified in settingsExploration.R
Main reactives:
Calls
uncertaintyDefinition.server()with id uncertaintyDefinitionCalls
uncertaintyPropagation.server()with id uncertaintyPropagationCalls
sensitivityAnalysis.server()with id sensitivityAnalysis
uncertaintyDefinition.R
source("modules/menuExplore/UQModel/UQparamsChange.R", local = TRUE)
UI and Server functions
- uncertaintyDefinition.ui(id)
This function populates the Step 1: Uncertainty Definition panel
- Parameters:
id (character) – namespace of the module
Main reactives:
Calls
UQparamsChange.ui()to allow uncertainty definition modificationCalls
UQparamsChange.ui.preview()to display uncertainty definition as a table
- uncertaintyDefinition.server(input, output, session, DOE)
- Parameters:
input (list-like-object) – stores the widgets’ values.
output (list-like-object) – stores the instructions to build R objects in the app.
session (object) – environment that can be used to access information and functionality relating to the session.
DOE (object) – stores the point values and the DOE information (e.g. bounds…)
Main reactives:
initialUQparams: default parameters, obtained by calling
initialize.UQparams()UQparams: calls module
UQparamsChange.server()with id UQParams
Main functions
- initialize.UQparams(Xinfos)
Initializes Uncertainty Quantification parameters according to the input data type
- Parameters:
Xinfos (object) – input variable information
uncertaintyPropagation.R
source("modules/shared/dynamicSelect.R", local = TRUE)
UI and Server functions
- uncertaintyPropagation.ui(id)
This function populates the Step 2: Uncertainty Propagation panel with two tabs:
Global Propagation
Probability Estimation
- Parameters:
id (character) – namespace of the module
Main reactives:
Global Propagation
go: button to propagate uncertainties
nsample: input to specifiy sample size
download: button to export UQ propagation
chooseVisu: plot type selection (“Probability Distribution Function” or “Cumulative Distribution Function”)
plot: displays selected plot
table: displays data as a table
Probability Estimation
signYUQproba: operator selection for threshold comparison
threshYUQproba: input to specifiy threshold
nsampleUQproba: input to specifiy sample size
goUQproba: button to compute probability
dobootproba: checkbox to resample data
naddproba: input to specifiy number of additional simulations in order to refine model for output values satisfying the defined constraint
generate: button to generate additional simulations
downloadproba: button to export additional simulations
plotproba: displays probability estimation plot
preview: displays proposed additional simulations as a table
- uncertaintyPropagation.server(input, output, session, DOE, listmodels, use_simulator, UQparams, settings)
- Parameters:
input (list-like-object) – stores the widgets’ values.
output (list-like-object) – stores the instructions to build R objects in the app.
session (object) – environment that can be used to access information and functionality relating to the session.
DOE (object) – stores the point values and the DOE information (e.g. bounds…)
listmodels (list) – list of trained models
use_simulator (logical) – informs if the user uses a simulator linked to Lagun
UQparams (list) – list of Uncertainty Quantification parameters
settings (list-like-object) – variables specified in settingsExploration.R
Main reactives:
Global Propagation
UQres: contains uncertainty quantification propagation data
output$plot: displays distribution function
output$table: displays UQres table
output$download: downloadable CSV file containing UQres
Probability Estimation
UQproba: contains uncertainty quantification probability data
output$plotproba: displays probability estimation plot
simulations$Xadd: contains computed additional simulations
output$tableproba: additional simulation table
output$preview: displays additional simulation table
output$downloadproba: downloadable CSV file containing additional simulations
Main functions
- getUQData(DOE, predfun, nsample, UQparams, Yinfos, callback)
Generates a UQ sample and predicts its output
- Parameters:
DOE (object) – stores the point values and the DOE information (e.g. bounds…)
predfun (function) – prediction function of the selected metamodel
nsample (numeric) – number of observations
UQparams (list) – list of Uncertainty Quantification parameters
Yinfos (object) – output variable information
callback (function) – reports progress
- getUQStats(DOE, UQsample, Yinfos)
Computes descriptive statistics on a UQ sample
- Parameters:
DOE (object) – stores the point values and the DOE information (e.g. bounds…)
UQsample (data.frame) – Uncertainty Quantification sample
Yinfos (object) – output variable information
- getUQDataProba(DOE, predfun, nrep, nsample, UQparams, id, sname, tname, callback)
Generates a UQ sample and predicts its output. Returns the mean, columnwise, of the data greater or lower than the threshold according to sname and tname
- Parameters:
DOE (object) – stores the point values and the DOE information (e.g. bounds…)
predfun (function) – predict function of the selected metamodel
nrep (numeric) – number of repetition
nsample (numeric) – number of observations
UQsample (data.frame) – Uncertainty Quantification sample
id (character) – output index
sname (character) – comparison operator
tname (numeric) – threshold
callback (function) – reports progress
- computeAdditionalSimulationsUQ(DOE, nadd, ntest, yname, tname, models, Yinfos, callback)
Generates additional input points for extra simulations, in order to improve the quality of the model. This points can be used if the user is able to compute extra simulations.
- Parameters:
DOE (object) – stores the point values and the DOE information (e.g. bounds…)
nadd (numeric) – number of points to add
ntest (numeric) – number of points to test for model improvement
yname (character) – output variable name
tname (character) – target variable name
models (list) – list of the trained models
Yinfos (object) – output variable information
callback (function) – reports progress
Plot functions
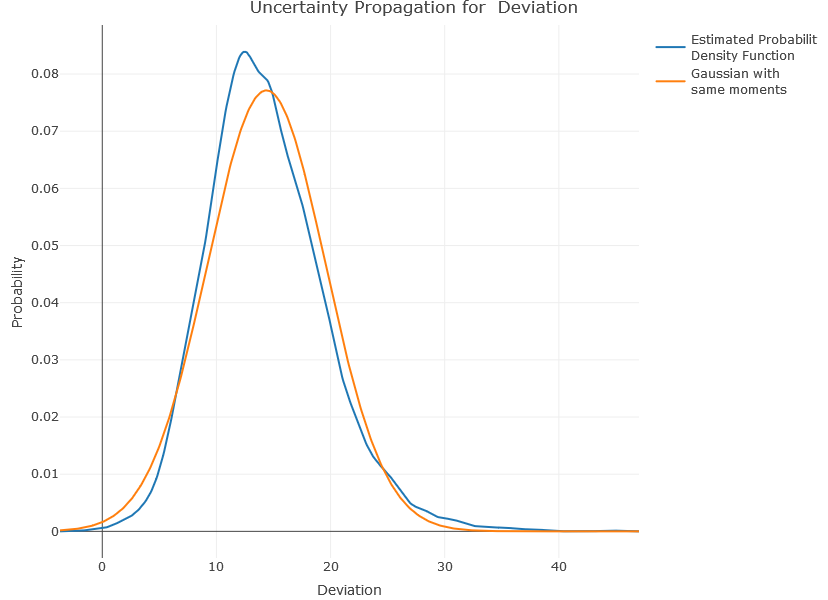
- plotUQ(DOE, idy, UQsample, typevisu)
Plots either the probability density function or the cumulative probability density function according to typevisu
- Parameters:
DOE (object) – stores the point values and the DOE information (e.g. bounds…)
idy (list) – output indices
UQsample (data.frame) – Uncertainty Quantification sample
typevisu (character) – type of plot
- plotUQproba(yname, sname, tname, UQproba)
Plots a boxplot to show the probability estimation
- Parameters:
yname (character) – output name
sname (character) – comparison operator
tname (numeric) – threshold
UQproba (list) – Uncertainty Quantification probability
Secondary functions
- callback(a)__
Reports progress of a task. Calls R Shiny incProgress
- Parameters:
i (numeric) – ath iteration
- callback2(r)
Reports progress of the resampling task. Calls R Shiny incProgress
- Parameters:
i (numeric) – rth iteration
sensitivityAnalysis.R
source("modules/menuImport/exploreDOE/quantitativeExploration.R", local = TRUE)
source("modules/shared/dynamicSelect.R", local = TRUE)
UI and Server functions
- sensitivityAnalysis.ui(id)
This function populates the Step 3: Sensitivity Analysis panel with three tabs:
First & Total Sobol Indices
Higher-Order Sobol Indices
Optimization Indices
- Parameters:
id (character) – namespace of the module
Main reactives:
First & Total Sobol Indices
ui.sobol: populates tab
download: button to export GSA results
plotGSAcomplete: displays heatmaps
Higher-Order Sobol Indices
ui.sobolhigh: populates tab
dthighorder: displays high-order data as a table
Optimization Indices
ui.optim: populates tab
- sensitivityAnalysis.server(input, output, session, DOE, ML, listmodels, UQparams, window.dimension, settings)
- Parameters:
input (list-like-object) – stores the widgets’ values.
output (list-like-object) – stores the instructions to build R objects in the app.
session (object) – environment that can be used to access information and functionality relating to the session.
DOE (object) – stores the point values and the DOE information (e.g. bounds…)
ML (object) – stores the quantitative exploration of the data
listmodels (list) – list of trained models
use_simulator (logical) – informs if a simulator is connected to Lagun
UQparams (list) – list of Uncertainty Quantification parameters
window.dimension (object) – dimensions of the window
settings (list-like-object) – variables specified in settingsExploration.R
Main reactives:
First & Total Sobol Indices
output$ui.sobol:
goGSA: button to compute
resamplesobol: checkbox to resample data
chooseY: output variable selection
plotGSA: displays plot
output$plotGSA: builds first order and total indices plot
output$plotGSAcomplete: builds heatmaps
output$download: downloadable CSV file containing sensitivity analysis data
Higher-Order Sobol Indices
output$ui.sobolhigh:
selecthighorder: second-order interaction selection
goGSAhighorder: button to compute second-order interactions
resamplesobolhighorder: checkbox to resample data
chooseYhighorder: output variable selection
plotGSAhighorder: displays plot
output$dthighorder: displays high-order data as a table
output$plotGSAhighorder: builds high-order plot
Optimization Indices
output$ui.optim:
chooseYOptim: output variable selection
GSAsign: comparison operator selection
goGSAoptim: button to compute optimization indices
GSAquantile: slider to select percentage (quantile)
plotGSAOptim: displays optimization plot
output$plotGSAOptim: builds optimization plot
Main functions
- computeGSAres(DOE, UQparams, predfun, nrep, nsample, Yinfos, Ylevel_target, callback)
Computes the Monte Carlo estimation of the Sobol indices for both first-order and total indices. [1] Returns a list with the indices along with their median.
- Parameters:
DOE (object) – stores the point values and the DOE information (e.g. bounds…)
UQparams (list) – Uncertainty Quantification parameters
predfun (function) – predict function of the selected metamodel
nrep (numeric) – number of repetitions
nsample (numeric) – UQ sample size
Yinfos (object) – output variable information
Ylevel_target (character) – categorical output class for sensitivity analysis
callback (function) – reports progress
- computeShapleyres(DOE, UQparams, predfun, nrep, nsample, Yinfos, Ylevel_target, permutations, callback)
Computes the estimation of Shapley effects using only N model evaluations via nearest neighbour search. [2] Returns a list with the indices along with their median.
- Parameters:
DOE (object) – stores the point values and the DOE information (e.g. bounds…)
UQparams (list) – Uncertainty Quantification parameters
predfun (function) – predict function of the selected metamodel
nrep (numeric) – number of repetitions
nsample (numeric) – UQ sample size
Yinfos (object) – output variable information
Ylevel_target (character) – categorical output class for sensitivity analysis
permutations (logical) – informs whether random permutations are used to estimate Shapley effects
callback (function) – reports progress
- detectGSAgaps(S1, S1med, ST, STmed, th, Yinfos)
Computes for all inputs and outputs the gap delta between the total and first order Sobol indices (delta = ST - S1) to detect interactions. Interactions are significant if delta is greater than the threshold th for at least half of the repetitions of Sobol index computations. If no interaction is significant, the two inputs with the highest delta are returned for each output.
- Parameters:
S1 (matrix) – Sobol first-order indices
S1med (matrix) – S1 median
ST (matrix) – Sobol total indices
STmed (matrix) – ST median
th (numeric) – threshold by which a gap is indicative (0.05 is used)
Yinfos (object) – output variable information
- computeGSAres.highorder(DOE, UQparams, predfun, nrep, nsample, Yinfos, list.indices, Ylevel_target, callback)
Computes high-order sobol indices
- Parameters:
DOE (object) – stores the point values and the DOE information (e.g. bounds…)
UQparams (list) – Uncertainty Quantification parameters
predfun (function) – predict function of the selected metamodel
nrep (numeric) – number of repetitions
nsample (numeric) – UQ sample size
Yinfos (object) – output variable information
list.indices (list) – list of input variable indices to compute second order Sobol indices for each output
Ylevel_target (character) – categorical output class for sensitivity analysis
callback (function) – reports progress
- computeGSAOptimres(DOE, UQparams, predfun, ynamemenu, GSAquantile, GSAsign, nrep, nsample, Yinfos, callback)
Computes optimization indices
- Parameters:
DOE (object) – stores the point values and the DOE information (e.g. bounds…)
UQparams (list) – Uncertainty Quantification parameters
predfun (function) – predict function of the selected metamodel
ynamemenu (character) – predicted variable name processed for menus
GSAquantile (numeric) – quantile
GSAsign (character) – optimization type (minimize or maximize)
nrep (numeric) – number of repetitions
nsample (numeric) – UQ sample size
Yinfos (object) – output variable information
callback (function) – reports progress
Plot functions
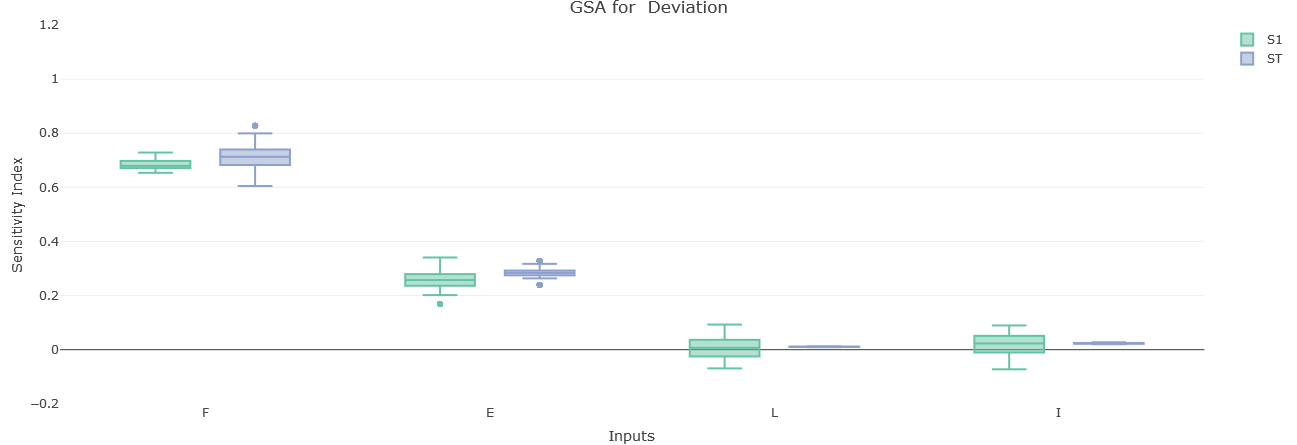
- plotGSA(DOE, ynamemenu, S1, ST, nsample, Yinfos)
Plots the GSA boxplot for a specific output. The sensitivity index dispersion is shown for each input, and both Sobol Indices (first and total).
- Parameters:
DOE (object) – stores the point values and the DOE information (e.g. bounds…)
ynamemenu (character) – predicted variable name processed for menus
S1 (matrix) – Sobol first-order indices
S1 – Sobol total indices
nsample (numeric) – sample size
Yinfos (object) – output variable information
- plotGSAOptim(DOE, S1, ynamemenu, nsample)
Plots the GSA optimization boxplot for a specific output. The sensitivity index dispersion is shown for each input.
- Parameters:
DOE (object) – stores the point values and the DOE information (e.g. bounds…)
S1 (matrix) – Sobol first-order indices
ynamemenu (character) – predicted variable name processed for menus
nsample (numeric) – sample size
- plotGSAhighorder(DOE, ynamemenu, S2, idS2, nsample, Yinfos, adapt.visu)
Plots the second-order Sobol indices for a specific output as a grouped boxplot.
- Parameters:
DOE (object) – stores the point values and the DOE information (e.g. bounds…)
ynamemenu (character) – predicted variable name processed for menus
S2 (matrix) – Sobol higher-order indices
idS2 (matrix) – input variables indices for which second-order Sobol indices are computed
nsample (numeric) – sample size
Yinfos (object) – output variable information
adapt.visu (logical) – adapt plot to window
- plotGSAcomplete(DOE, S1med, STmed, Yinfos)
Plots two heatmaps: one for first-order indices, the other one for total indices Shows the effect of the inputs.
- Parameters:
DOE (object) – stores the point values and the DOE information (e.g. bounds…)
S1med (matrix) – Sobol first-order indices median
STmed (matrix) – Sobol total indices median
Yinfos (object) – output variable information
- plotShapley(DOE, ynamemenu, S, nsample, Yinfos)
Plots Shapley effects for a specific output as a boxplot.
- Parameters:
DOE (object) – stores the point values and the DOE information (e.g. bounds…)
ynamemenu (character) – predicted variable name processed for menus
S (vector) – estimations of the Sobol sensitivity indices
nsample (numeric) – sample size
Yinfos (object) – output variable information
- plotShapleycomplete(DOE, Smed, Yinfos)
Plots a heatmap of the Shapley effects to show the effect of the inputs.
- Parameters:
DOE (object) – stores the point values and the DOE information (e.g. bounds…)
Smed (vector) – medians of the estimations of the Sobol sensitivity indices
Yinfos (object) – output variable information
Secondary functions
- getDataframeGSAres(DOE, GSAres, Yinfos)
Binds the medians of the estimations of the Sobol first-order indices and the estimations of the Sobol total sensitivity indices
- Parameters:
DOE (object) – stores the point values and the DOE information (e.g. bounds…)
GSAres (list) – list of matrices, returned by
computeGSAres()Yinfos (object) – output variable information
- getDataframeShapleyres(DOE, Shapleyres, Yinfos)
Returns the medians of the estimations of the Sobol sensitivity indices
- Parameters:
DOE (object) – stores the point values and the DOE information (e.g. bounds…)
GSAres (list) – list of matrices, returned by
computeShapleyres()Yinfos (object) – output variable information
- subsets(set, size=length(set), type='leq')
Creates a subset from an existing set, according to the expected size
- Parameters:
set (list) – set to extract a subset from
size (numeric) – expected size of the subset (default=length(set))
type (character) – comparison operator (default=”leq”)
- callback(r)__
Reports progress of a task. Calls R Shiny incProgress
- Parameters:
i (numeric) – rth iteration
UQparamsChange.R
UI and Server functions
- UQparamsChange.ui(id)
This function helps populating
uncertaintyDefinition.ui()modal window, it allows to change uncertainty definition- Parameters:
id (character) – namespace of the module
Main reactives:
change: button to open modal window and change uncertainty definition
separator: radio buttons to choose value delimiter
decimal: radio buttons to choose decimal separator
file: input to upload a file
warning.file: displays the possible errors after checking the file
reset: button to reset values
unifReset: button to reset all distribution types to uniform
- UQparamsChange.ui.preview(id)
This function helps populating
uncertaintyDefinition.ui(), it displays uncertainty definition as a table- Parameters:
id (character) – namespace of the module
Main reactives:
download: button to export uncertainty definition data
preview: displays uncertainty definition data as a table
- UQparams.row.ui(i, ns, input, UQparams, Xinfos, error.msg)
Builds UI for UQParams definition / modification
- Parameters:
i (integer) – input variable number
ns (character) – namespaced ID
input (list-like-object) – stores the widgets’ values.
UQparams (list) – Uncertainty Quantification parameters
Xinfos (object) – input variable information
error.msg (object) – error messages
Main reactives:
name: text input for the variable name
typeDistr: distribution type selection
P1Distr, P2Distr, P3Distr, P4Distr: numeric inputs according to the distribution type
level: text input for levels if the variable is categorical
levelproba: weights for the levels
- UQparamsChange.server(input, output, session, initialUQparams, DOE, verbose=FALSE)
- Parameters:
input (list-like-object) – stores the widgets’ values.
output (list-like-object) – stores the instructions to build R objects in the app.
session (object) – environment that can be used to access information and functionality relating to the session.
initialUQparams (list) – default uncertainty quantification parameters
DOE (object) – stores the point values and the DOE information (e.g. bounds…)
verbose (logical) – option to provide additional details during the process (default=FALSE)
Main reactives:
output$warning.file: text output to display potential errors after checking the input file
output$footer:
save: button to save and close the modal window
close: button to cancel uncertainty definition modification
output$preview: displays UQ parameters as a table
output$download: downloadable CSV file containing UQ parameters
Main functions
- setAllEstimated(Xinfos)
Sets distribution to estimated for each variable.
- Parameters:
Xinfos (data.table) – variable informations (name, type, lower bound, upper bound, number of levels, levels)
- get.UQparams(ind, line, DOE, decimal)
Get parameters stored in line
- Parameters:
ind (character) – variable index for which to get parameters
line (vector) – line containing parameters
DOE (object) – stores the point values and the DOE information (e.g. bounds…)
decimal (character) – decimal separator
- check.UQparams.file(nX, Xinfos, lines, decimal)
Checks validity of input file
- Parameters:
nX (numeric) – number of inputs
Xinfos (object) – input variable information
lines (vector) – lines read from file
decimal (character) – decimal separator
- get.UQparams.from.file(DOE, datapath, separator, decimal)
Get parameters stored in file using
get.UQparams()for each line- Parameters:
DOE (object) – stores the point values and the DOE information (e.g. bounds…)
datapath (character) – path to data file
separator (character) – delimiter used to separate values in the file
decimal (character) – decimal separator
- get.UQparams.from.input(input, Xinfos)
Get parameters entered by the user
- Parameters:
input (vector) – input manually entered in the UI
Xinfos (object) – input variable information
- UQparams.check(UQparams.temp)
Check parameters entered by the user
- Parameters:
UQparams.temp (vector) – input manually entered in the UI
- UQparams.normalize(UQparams.temp)
Normalizes the weights of the cateogorical inputs.
Divides each weight by the sum of the weights
- Parameters:
UQparams.temp (vector) – input manually entered in the UI
- get.UQparams.df(UQparams, Xinfos, ncolumns)
Turns the list of parameters into a data.frame with the right column names and row names
- Parameters:
UQparams (list) – Uncertainty Quantification parameters
Xinfos (object) – input variable information
ncolumns (numeric) – number of columns
- get.UQparams.download(UQparams, Xinfos, separator, decimal)
Shapes UQParams to properly write them into a file
- Parameters:
UQparams (list) – Uncertainty Quantification parameters
Xinfos (object) – input variable information
separator (character) – delimiter used to separate values in the file
decimal (character) – decimal separator
distributionfitting.R
source("modules/menuExplore/UQModel/testfunctions.R", local = TRUE)
UI and Server functions
- distributionfitting.ui(id)
This function adds the tab Distribution Fitting to the Uncertainty Definition panel.
It contains itself three more tabs:
Data to Fit Marginals
Distribution Fitting (marginals)
Select Distributions (marginals)
- Parameters:
id (character) – namespace of the module
- distributionfitting.server(input, output, session, UQparams, listCopulas, DOE)
- Parameters:
input (list-like-object) – stores the widgets’ values.
output (list-like-object) – stores the instructions to build R objects in the app.
session (object) – environment that can be used to access information and functionality related to the session.
UQparams (list) – list of Uncertainty Quantification parameters
listCopulas (list) – list of copulas
DOE (object) – stores the point values and the DOE informations (e.g. bounds…)
Main reactives:
data.to.fit.marginals: contains data to fit marginals
data.to.fit.copulas: contains data to fit copula
TempEstimDist: contains temporary estimated distribution
FinalEstimDist: contains final estimted distribution
CopulaType: contains the type of copula
output$plotDhist: plots distribution histogram
output$plotFDhist: plots distribution fit histogram
output$plotFDqqplot: plots distribution fit QQ-Plot
output$tableTests: displays the results of GOF tests, see
computeGOF
Main functions
- ComputeGOF(nameTest, sample, distr, fit, resample)
Computes Goodness-of-Fit with three possible tests :
Kolmogorov - Smirnov
Anderson - Darling
Cramer - Von Mises
- Parameters:
nameTest (character) – test to compute
sample (vector) – vector of data
distr (character) – distribution to test
fit (list) – estimated parameters
resample (logical) – informs whether to resample the data or not
testfunctions.R
Main functions
- ad.test.one(x, distr, fit)
Performs Anderson-Darling test
- Parameters:
x (vector) – data
distr (character) – distribution to test
fit (list) – estimated parameters
- ad.test.rep(x, distr, fit, nrep=4999)
Performs Anderson-Darling test with resampling
- Parameters:
x (vector) – data
distr (character) – distribution to test
fit (list) – estimated parameters
nrep (numeric) – number of repetitions (default=4999)
- cvm.test.one(x, distr, fit)
Performs Cramer-Von Mises test
- Parameters:
x (vector) – data
distr (character) – distribution to test
fit (list) – estimated parameters
- cvm.test.rep(x, distr, fit, nrep=4999)
Performs Cramer-Von Mises test with resampling
- Parameters:
x (vector) – data
distr (character) – distribution to test
fit (list) – estimated parameters
nrep (numeric) – number of repetitions (default=4999)
- ks.test.one(x, distr, fit)
Performs Kolmogorov-Smirnov test
- Parameters:
x (vector) – data
distr (character) – distribution to test
fit (list) – estimated parameters
- ks.test.rep(x, distr, fit, nrep=4999)
Performs Kolmogorov-Smirnov test with resampling
- Parameters:
x (vector) – data
distr (character) – distribution to test
fit (list) – estimated parameters
nrep (numeric) – number of repetitions (default=4999)
Secondary functions
- closed.form.estimators(distr, x)
Computes estimated parameters
- Parameters:
distr (character) – distribution to test
x (vector) – data
UQparamsDependence.R
UI and Server functions
- UQparamsDependence.ui(id, label)
Creates a modal window to change the inputs’ dependence definition.
- Parameters:
id (character) – namespace of the module
label (character) – action button label
- UQparamsDependence.server(input, output, session, initiallistCopulas, fitdistUQparams, DOE)
- Parameters:
input (list-like-object) – stores the widgets’ values.
output (list-like-object) – stores the instructions to build R objects in the app.
session (object) – environment that can be used to access information and functionality related to the session.
initiallistCopulas (list) – initial list of copulas
fitdistUQparams (object) – UQ parameters for distribution fitting
DOE (object) – stores the point values and the DOE informations (e.g. bounds…)
Main reactives:
listCopulas: list of copulas
Xnum: contains the numerical inputs
output$copulaInputs.dynui: UI to specify the groups and copula definition
output$group.dynui: UI to specify the independent inputs belonging to each group
output$paramcopula.dynui: UI to specify the copula parameters