Prepare DOE
Tutorial
Design of experiments |
|

Architecture

prepareDOE.R
UI and Server functions
source("modules/prepareDOE/generateDOE.R", local = TRUE)
- prepareDOE.ui(id)
This function creates the panel Generate DOE and populates it by calling the
generateDOE.ui()function- Parameters:
id (character) – namespace of the module
- prepareDOE.server(input, output, session, settings)
This function builds a list-like object named output that contains all of the code needed to update the R objects in the app.
- Parameters:
input (list-like-object) – stores the widgets’ values.
output (list-like-object) – stores the instructions to build R objects in the app.
session (object) – environment that can be used to access information and functionality relating to the session.
settings (list-like-object) – variables specified in settingsDOE.R
Main reactives:
calls
generateDOE.server()
generateDOE.R
source("modules/shared/XinfosChange.R", local = TRUE)
source("modules/prepareDOE/evaluateDOE.R", local = TRUE)
source("modules/prepareDOE/visualizeDOE.R", local = TRUE)
UI and Server functions
- generateDOE.ui(id)
This function populates the Generate DOE panel
- Parameters:
id (character) – namespace of the module
Main reactives:
Left column
nX: number of inputs
bounds: input definition/edition using
XinfosChange.ui()DOE.type: DOE method selection
nobs.UI: sample size selection
Content
Previews the input definition with
XinfosChange.ui.preview(ns("bounds"))
Bottom
goDOE: button to generate DOE
prepare.gocheckDOE: button to evaluate DOE
download: button to export DOE
plotVisualize: calls visualizeDOE module, displays a pairplot to visualize the DOE points repartition. Appears after DOE generation
- generateDOE.server(input, output, session, settings)
This function builds a list-like object named output that contains all of the code needed to update the R objects in the app.
- Parameters:
input (list-like-object) – stores the widgets’ values.
output (list-like-object) – stores the instructions to build R objects in the app.
session (object) – environment that can be used to access information and functionality relating to the session.
settings (list-like-object) – variables specified in settingsDOE.R
Main reactives:
DOE is the reactive expression that stores the point values and the DOE informations (e.g. bounds…)
Xinfos: stores the bound definition
initialXinfos: Xinfos generated by default
var.num, var.cat: store the names of the variables (numerical and categorical)
goDOE: button to generate the DOE, calls
generateDOEXopt()output$scatter: generates the pairplot to visualize the DOE
plotVisualize: calls visualizeDOE module, displays the pairplot
output$download: generates a downloadable CSV file with DOE$Xopt variable
Main functions
- sobolsequencecat(u, lvls, weights)
Generates a DOE using a Sobol sequence
- Parameters:
u (vector) – vector of observations (sobol sequence)
lvls (vector) – vector of levels
list (vector) – list of weights, could be a scalar if the levels share the same weight
- Returns:
the DOE
- Return type:
vector
- generate.DOE.Xopt(nX, nobs, nobs.slide, DOEtype, Xinfos, names.num, names.cat)
Generates the design of experiment (DOE) using one of the following methods (DOEtype):
Methods for numerical variables
LHS Maximin [1]
LHS Discrepancy [2]
LHS MaxProj (Optimal but slow) [3]
Sobol Sequence (Fast but suboptimal exploration) [5]
Methods for mixed DOE (categorical and numerical variables)
LHS for Categorical Inputs (Optimal but large sample size) [4]
Mixed Sobol Sequence (Fast but suboptimal exploration) [5]
- Parameters:
nX (integer) – number of inputs
nobs (integer) – number of observations
nobs.slide (integer) – sample size for each category
DOEtype (character) – method used to generate the DOE points
Xinfos (data.table) – variable informations (name, type, lower bound, upper bound, number of levels, levels)
names.num (vector) – names of numerical variables
names.cat (vector) – names of categorical variables
- Returns:
the generated DOE
- Return type:
data.table
Secondary functions
- check.input.size(input, min.value)
Compares the value of input and min.value, input must not be less than min.value.
- Parameters:
input (integer) – number of inputs
min.value (integer) – minimum inputs allowed
- Returns:
FALSEif input is strictly less than min.value,TRUEotherwise- Return type:
logical
evaluateDOE.R
UI and Server functions
- evaluateDOE.ui(id)
This function builds the modal window, it is displayed by clicking on Evaluate DOE
- Parameters:
id (character) – namespace of the module
Main reactives:
check: button that calls
compute.checkDOE()plot: displays
plot.checkDOE()plotLHS: displays
plot.checkDOE.LHS()
- evaluateDOE.server(input, output, session, DOE, settings)
This function builds a list-like object named output that contains all of the code needed to update the R objects in the app.
- Parameters:
input (list-like-object) – stores the widgets’ values.
output (list-like-object) – stores the instructions to build R objects in the app.
session (object) – environment that can be used to access information and functionality relating to the session.
DOE (object) – stores the informations related to the DOE
settings (list-like-object) – variables specified in settingsDOE.R
Main reactives:
checkDOE is the reactive expression that stores the list of DOEs generated by function
compute.checkDOE()Xinfos: used to define the bounds
initialXinfos: Xinfos generated by default
output$plot: generates the plot using the
plot.checkDOE()functionoutput$plotLHS: generates the plot using the
plot.checkDOE.LHS()function
Main functions
- get.listDOE(Xopt, lb, ub, ntestMC, callback)
Creates a list with different DOE types.
The DOE types are the following:
Faure, Halton and Sobol are low discrepency sequences
MC is a random Monte Carlo sample
DOE is the user’s
- Parameters:
Xopt (data.table) – DOE points generated
lb (numeric) – lower bound
ub (numeric) – upper bound
ntestMC (numeric) – number of MC DOE for comparison
callback (function) – function used to report progress
- Returns:
list of DOEs
- Return type:
list
Plot functions
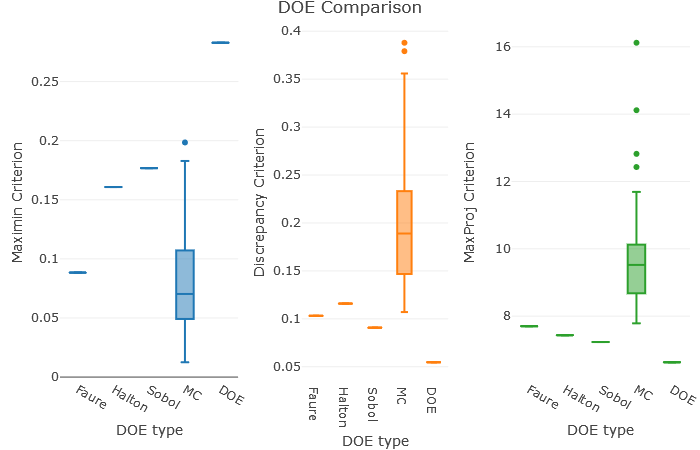
- plot.checkDOE(listDOE)
Three boxplots are displayed in order to compare the DOE types according to three criterions:
The DOE types are the following:
Faure, Halton and Sobol are low discrepency sequences
MC is a random Monte Carlo sample
DOE is the user’s
- Parameters:
listDOE (list) – list of DOEs, generated by get.listDOE()
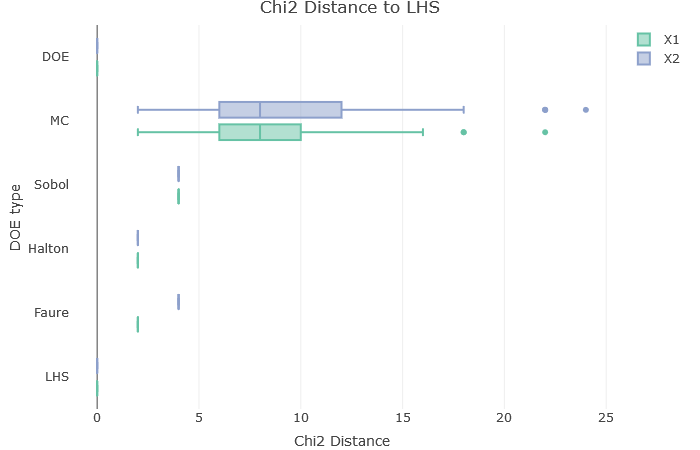
- plot.checkDOE.LHS(listDOE)
Diplays a boxplot to compare the chi2 distance between the different DOE types and the LHS for each variable. It shows how far the points are from a LHS position, and gives an insight about the quality of the repartition.
- Parameters:
listDOE (list) – list of DOEs
Secondary functions
- compute.checkDOE(Xopt, Xinfos, ntestMC, all.numeric)
Checks if the all the values are numeric since no evaluation method is available for a DOE with categorical variables. If it is true, calls the function get.listDOE() to create a list of DOEs in order to compare them.
- Parameters:
Xopt (data.table) – DOE points generated
Xinfos (data.table) – variable information (name, type, lower bound, upper bound, number of levels, levels)
ntestMC (numeric) – number of MC DOE for comparison
all.numeric (logical) –
TRUEif all the variables are numeric,FALSEotherwise
- Returns:
list of DOEs
- Return type:
list
visualizeDOE.R
UI and Server functions
- visualizeDOEUI(id)
Displays the pairplot and two pickerInputs for the numeric variables, and the levels of categorical variables.
- Parameters:
id (character) – namespace of the module
Main reactives:
numericSelection: numeric variable selection
categoricalSelection: categorical variable selection
numSelectionClosed: informs whether the numericSelection picker is loaded or hidden
catSelectionClosed: informs whether the categoricalSelection picker is loaded or hidden
pairPlot: displays the pairplot
- visualizeDOEServer(id, data, numericVariables, categoricalVariables, mapNames)
- Parameters:
id (character) – namespace of the module
data (data.table) – table containing the data
numericVariables (vector) – contains the numeric variable names
categoricalVariables (vector) – contains the categorical variable names
mapNames (data.frame) – a data.frame with 3 columns (names, menu, visu), containing the different names of the variables. They can be different in the data table, the menus, or the plots
Main reactives:
numericSelection: numeric variable selection
categoricalSelection: categorical variable selection
output$pairPlot: builds the pairplot
Plot functions
- pairPlot(data, numericSelection, categoricalSelection, mapNames)
Creates a pairplot to visualize the DOE point repartition. The points are colorized by group of levels if categoricalSelection is not NULL.
- Parameters:
data (data.table) – table containing the data
categoricalSelection (vector) – contains the numeric variable names selected by the user
categoricalSelection – contains the categorical variable names selected by the user
mapNames (data.frame) – a data.frame with 3 columns (names, menu, visu), containing the different names of the variables. They can be different in the data table, the menus, or the plots
Secondary functions
- getJsPickerEvent(pickerID, shinyInputID)
Returns two javascript functions to trigger an event when the menu is loaded, and when it’s hidden.
- Parameters:
pickerID (character) – the picker on which to apply the functions
shinyInputID (character) – the desired name for the event, will be used as an input in the shiny app
- buildCategoricalSelection(data, categoricalVariables, mapNames, separator='|')
Creates a list of named lists. The sublists are named after the categorical variables, they contain their levels. As the pickerInput returns a vector with the selection, and in order to identify which level belong to which variable, the variables names and levels are concatenated using the separator (“|” by default).
- Parameters:
data (data.table) – table containing the data
categoricalVariables (vector) – contains the categorical variable names
mapNames (data.frame) – a data.frame with 3 columns (names, menu, visu), containing the different names of the variables. They can be different in the data table, the menus, or the plots
separator (character) – character used to separate the variable name from the level (default = “|”)
- buildCatLevelsList(categoricalSelection, separator='|')
Splits the elements of the selection by the separator (“|” by default) and builds a list of named lists. Each list contains the selected levels for each variable.
- Parameters:
categoricalSelection (vector) – contains the categorical variable names selected by the user
separator (character) – character used to separate the variable name from the level (default = “|”)