Menu Import
Tutorials
DOE Import and Simulator Configuration |
|
Exploration |
|

Architecture

Import DOE
importDOE.R
source("modules/menuImport/importDOE/uploadDOE.R", local = TRUE)
source("modules/menuImport/importDOE/confSimulator.R", local = TRUE)
UI and Server functions
- importDOE.ui(id)
Displays the panel asking to use a simulator, and the panel to upload a file
- Parameters:
id (character) – namespace of the module
- importDOE.server(input, output, session, DOEX, Xadd, XaddUQ, XaddSeqOptim, XaddUnconstOptim, XaddConstOptim, settings, import.clicked)
- Parameters:
input (list-like-object) – stores the widgets’ values.
output (list-like-object) – stores the instructions to build R objects in the app.
session (object) – environment that can be used to access information and functionality related to the session.
DOEX (list) – stores the input point values and the DOE input information (e.g. bounds…)
Xadd (object) – extra points in the DOE to refine the model
XaddUQ (object) – extra points in the DOE to refine the model in specific zones (low and/or high values)
XaddSeqOptim (object) – extra points in the DOE to refine the model for a sequential optimization
XaddUnconstOptim (object) – extra points in the DOE to confirm unconstrained optimization results
XaddConstOptim (object) – extra points in the DOE to confirm constrained optimization results
settings (list-like-object) – variables specified in settingsDOE.R
import.clicked (logical) –
TRUEwhen the tab import DOE is clicked
Main reactives:
upload_file_bool: checks if the user uploaded a file
use_simulator: checks if the user wants to connect a simulator
Three data import use cases are available, hence the need of upload_file_bool:
Upload a file
Use a simulator and the DOE generated in the prepareDOE tab
Use a simulator and upload a file
- dataModal()
creates graphical elements
uploadDOE.R
source("modules/shared/XinfosChange.R", local = TRUE)
source("modules/shared/XactiveChange.R", local = TRUE)
source("modules/shared/YinfosChange.R", local = TRUE)
source("modules/shared/XYnamesChange.R", local = TRUE)
source("modules/shared/missingValChange.R", local = TRUE)
source("modules/shared/dynamicSelect.R", local = TRUE)
source("modules/prepareDOE/evaluateDOE.R", local = TRUE)
source("modules/prepareDOE/visualizeDOE.R", local = TRUE)
source("modules/menuImport/importDOE/compositeFunction.R", local = TRUE)
source("modules/menuImport/importDOE/importDiscretization.R", local = TRUE)
UI and Server functions
- uploadDOE.ui(id)
displays graphical components for the upload process
- Parameters:
id (character) – namespace of the module
- uploadDOE.server(input, output, session, settings)
- Parameters:
input (list-like-object) – stores the widgets’ values.
output (list-like-object) – stores the instructions to build R objects in the app.
session (object) – environment that can be used to access information and functionality related to the session.
settings (list-like-object) – variables specified in settingsDOE.R
Main reactives:
output$import.dynui: displays UI by taking into account displayui$mode
displayui$mode: the mode changes along the process to display the right UI
output$tabimport.dynui: displays UI by calling three ids: upload.dynui, sepdec.dynui, preview.dynui
output$upload.dynui: displays import elements
output$sepdec.dynui: displays elements to change the separator and the decimal character
file.data: reads and stores file content
output$preview.dynui: displays a preview of the file to check the loading
output$preview: displays output variables information
output$taboutputs.dynui: displays elements to change output types and shows some output information
DOEfinal: contains the DOE definition and data
output$tabfinish.dynui: displays a summary before import confirmation
Main functions
- my.summary(x, ...)
Computes descriptive statistics: mean, standard-deviation, min, max, quantile variation
- Parameters:
x (vector) – vector of numeric data
.... (-) – ellipsis
- Returns:
computed statistics
- Return type:
vector
- compute.summary(Y, my.summary, Yinfos)
Computes summary for all variables
- Parameters:
Y (data.frame) – data
my.summary (function) – computes descriptive statistics
Yinfos (list) – variable information
- Returns:
computed statistics
- Return type:
matrix
- checkValid.XYData(XY, nX)
Checks the validity of XYData using three conditions:
XY must be not null
XY must be a data.frame
nX must be greater than the number of columns in XY
- Parameters:
XY (data.frame) – data
nX (numeric) – number of variables
- Returns:
TRUEif valid,FALSEotherwise- Return type:
logical
- get.XYdata(XY, nX, header, firstcol, namesvisu, namesmenu)
Forms the data in the right shape for Lagun
- Parameters:
XY (data.frame) – experience parameters and outputs
nX (numeric) – number of variables
header (logical) – presence of header
firstcol (logical) – if the first column indicates the observation number
namesvisu (vector) – vector of variable names processed for plots
namesmenu (vector) – vector of variable names processed for menus
- Returns:
XYData
- Return type:
list
Secondary functions
- get.Xinfos.col(ind, XDOE, xnames, xnamesvisu, xnamesmenu, nvalues)
Evaluates whether the variable’s type is numeric, a constant, or categorical
- Parameters:
ind (numeric) – index of column to evaluate
XDOE (data.frame) – stores the input point values and the input DOE information (e.g. bounds…)
xnames (vector) – vector of variable names
namesvisu (vector) – vector of variable names processed for plots
namesmenu (vector) – vector of variable names processed for menus
nvalues (numeric) – number of values for the variable
- Returns:
Xinfos.col
- Return type:
list
- get.Yinfos.col(ind, YDOE, nvalues, threshold.var)
Focuses on the target variables. Evaluates its type: status (if not numeric), constant or interest
- Parameters:
ind (numeric) – index of column to evaluate
YDOE (object) – stores the output point values and the DOE output information (e.g. bounds…)
nvalues (numeric) – number of values for the variable
threshold.var (numeric) – threshold variation, if the quantile variation is below this threshold, the variable is considered a constant
- Returns:
Yinfos.col
- Return type:
list
compositeFunction.R
UI and Server functions
- compositeFunctionUI(id)
- Parameters:
id (character) – namespace of the module
Main reactives:
createCompFunc: button to call the modal modalAddCompFunc that allows to create a composite output
existingCompFunc: displays the existing composite outputs, alongside with a delete button
- compositeFunctionServer(id, DOE)
- Parameters:
id (character) – namespace of the module
DOE (object) – stores the point values and the DOE information (e.g. bounds…)
Main reactives:
output$existingCompFunc: displays the existing composite outputs, alongside with a delete button
output$modalAddCompFunc: modal that allows to create a composite output
output$latexFormula: displays the formula in latex format
input$addCompFunc: performs a few checks, creates the composite output and updates compositeInfos object
Main functions
- latexify(formula, name)
This functions translates the formula in R language into a latex formula
- Parameters:
formula (character) – formula entered by the user
name (character) – name of the composite output
- getUsedParams(formula, ynames)
Identifies the output(s) used in the formula
- Parameters:
formula (character) – formula entered by the user
ynames (list) – list of the output names in the DOE
- checkName(name, xnames, ynames)
Performs the following verifications on the name:
It must not be empty
It must be unique
it must only contain letters, numbers, “_”, and “.”
- Parameters:
name (character) – name of the composite output (entered by the user)
xnames (list) – list of the input names in the DOE
ynames (list) – list of the output names in the DOE
- checkFormula(formula, usedParams, modelMode, type, Y)
Performs the following verifications on the formula:
It must not be empty
It must contain at least one output
It must be a valid expression
It must not trigger an error nor a warning when evaluated
It must only contain numbers if numeric type is selected
It must not contain log or ln if combine mode is selected
- Parameters:
formula (character) – formula entered by the user
usedParams (list) – parameters used in formula
modelMode (character) – informs whether a model should be trained or combine the models from the used parameters
type (character) – selected output type (numeric or categorical)
Y (data.frame) – output values of the imported DOE
Secondary functions
- findAllFunctions(formula, funcName, nbToFind, res)
Finds recusively all functions to replace in latexify function
- Parameters:
formula (character) – formula entered by the user
funcName (character) – add_description
nbToFind (numeric) – number of funcName to find in the formula (default=NULL)
res (list) – each element contains two fields, fullFunc (function name and its content) and content (expression between parentheses)
- indicator(expr)
Wrapper for ifelse function, returns ifelse(expr, 1, 0)
- Parameters:
expr (expression) – logical expression
- pln(y)
- \[ \begin{align}\begin{aligned}pln(y) &= \ln(1+ y'), \quad\mbox{if}\quad y' ≥ 0\\pln(y) &= -\ln(1- y'), \quad\mbox{if}\quad y' < 0\end{aligned}\end{align} \]
- Parameters:
y (vector) – data
- plog(y)
- \[ \begin{align}\begin{aligned}plog(y) &= \log(1+ y'), \quad\mbox{if}\quad y' ≥ 0\\plog(y) &= -\log(1- y'), \quad\mbox{if}\quad y' < 0\end{aligned}\end{align} \]
- Parameters:
y (vector) – data
Explore DOE
exploreDOE.R
source("modules/menuImport/exploreDOE/qualitativeExploration.R", local = TRUE)
source("modules/menuImport/exploreDOE/quantitativeExploration.R", local = TRUE)
UI and Server functions
- exploreDOE.ui(id)
This function creates the exploration page with two panels : qualitative exploration and quantitative exploration with Machine Learning tools
- Parameters:
id (character) – namespace of the module
Main reactives:
modalViewDOE: calls a modal view to display table of the current DOE
qualitativeExploration: populates the Qualitative Exploration panel
quantitativeExploration: populates the Quantitative Exploration panel
- exploreDOE.server(input, output, session, DOE, settings, prelimexplo.clicked, advance.importDOE, use_simulator, window.dimension)
This function builds a list-like object named output that contains all of the code needed to update the R objects in the app.
- Parameters:
input (list-like-object) – stores the widgets’ values.
output (list-like-object) – stores the instructions to build R objects in the app.
session (object) – environment that can be used to access information and functionality related to the session.
DOE (object) – stores the point values and the DOE information (e.g. bounds…)
settings (list-like-object) – variables specified in settingsDOE.R
prelimexplo.clicked (logical) – informs whether the user selected the preliminary exploration tab
advance.importDOE (object) – stores the simulation information status (completed/waiting/running) when Lagun is connected to an external simulator
use_simulator (logical) – informs if the user uses a simulator linked to Lagun
window.dimension (object) – dimensions of the window
Main reactives:
currentDOE: reactive expression containing the DOE definition
output$DTcurrentDOE: displays the DOE as a table
qualitativeExploration.server()module calledML: calls module
quantitativeExploration.server()
qualitativeExploration.R
source("modules/shared/dynamicSelect.R", local = TRUE)
source("modules/shared/dynamicSelectpicker.R", local = TRUE)
UI and Server functions
- qualitativeExploration.ui(id)
Displays the panel with three tabs, each containing an interactive plot.
- Parameters:
id (character) – namespace of the module
Main reactives:
Regression plot - One by One
chooseY: Y axis variable selector
chooseX: X axis variable selector
chooseRegColor: color marks by selected variable value
chooseRegSize: change size marks by selected variable value
chooseRegMark: change type of mark by selected variable value
showhist: switch button to display histograms on the axes
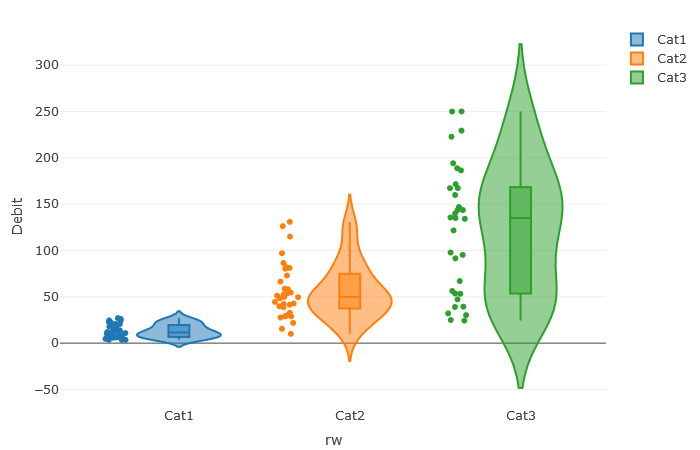
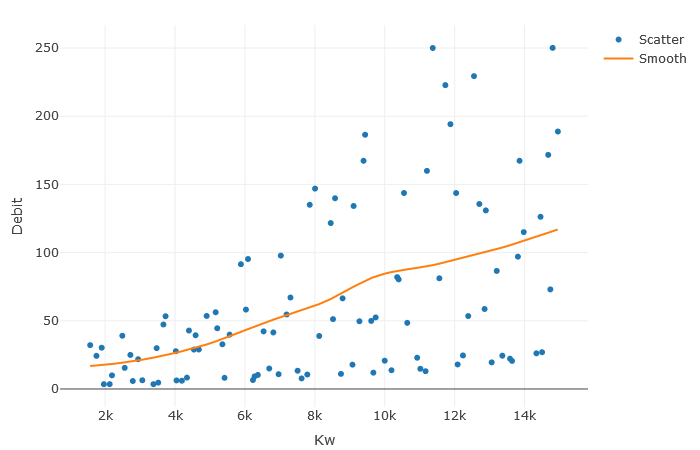
plot.reg: displays regression plot
Parallel coordinate plot
choose.palette.num: color palette selector for numerical variables
choose.palette.cat: color palette selector for categorical variables
downloadpcp: export plot
chooseXParcoords: input variables selector
chooseYParcoords: output variables selector
chooseHistParcoords: variable selection to display histogram
chooseBoundsParcoords: bound selection for a variable
parcoords: displays parallel plot
Regression plot - All in One
plot.allinone: displays regression plots for all variables, pairwise.
- qualitativeExploration.server(input, output, session, DOE, window.dimension)
- Parameters:
input (list-like-object) – stores the widgets’ values.
output (list-like-object) – stores the instructions to build R objects in the app.
session (object) – environment that can be used to access information and functionality related to the session.
DOE (object) – stores the point values and the DOE information (e.g. bounds…)
window.dimension (object) – dimensions of the window
- Returns:
DOE
- Return type:
object
Main reactives:
Regression plot - One by One
choicesX: contains all the variables for the X axis. Inputs come first.
Xcat: contains the input categorical variables
Ycat: contains the output categorical variables
Allcat: contains all the categorical variables
Allb: contains all the bounds
choicesY: contains all the variables for the Y axis. Outputs come first.
choicesRegColor: contains all the variables to apply different colors
choicesRegSize: contains all the continuous variables to apply different sizes
choicesRegMark: contains all the categorical variables to apply different mark types
output$regression: calls
plot.regression()output$plot.reg: displays the regression plot
Regression plot - All in One
choicesXallinone: contains all the input variables
currentview: computes the number of rows and columns in the lattice
input$goPrevious / goNext / goUp / goDown: navigation in the lattice
output$plot.allinone: descprition
output$ui.treillis: displays lattice navigation buttons
output$plotallinone.treillis: builds the plot
output$plot.allinone.inside: displays the plot
Parallel coordinate plot
choicesXParcoords: list of input variables
selectedXParcoords: selected input variables
choicesYParcoords: list of output variables
selectedYParcoords: selected output variables
choicesHistParcoords: list of all variables for histogram selection
choicesBoundsParcoords: list of all variables for bounds edition
output$dynui_bounds: renders UI
output$parcoords: displays the parallel plot
choicescluster: contains the variables to use for clustering
cluster: contains clusters computed with kMeans
output$downloadpcp: creates a downloadable html parallel plot
Plot functions
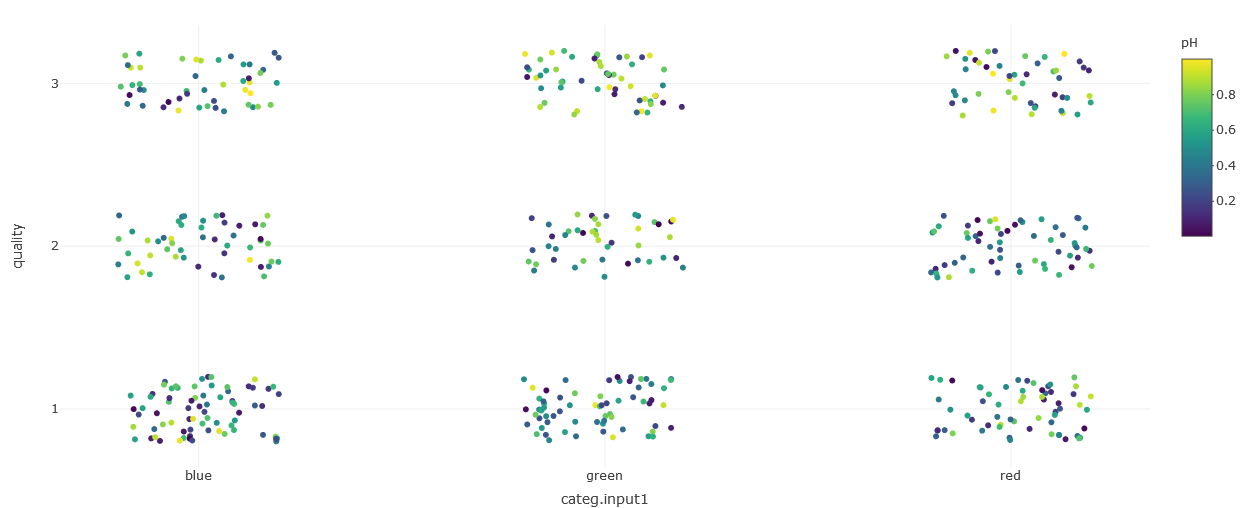
- plot.regression(df, xname, yname, colorname, sizename, markname, catnames, showhist, xnamevisu, ynamevisu, colnamevisu, adapt.visu)
Displays a plot to observe interactions between variables.
- Parameters:
df (data.frame) – data to plot
xname (character) – x name in df
yname (character) – y name in df
colorname (character) – colors to apply
sizename (numeric) – size to apply
markname (character) – mark to use
catnames (list) – categories names
showhist (logical) – informs if a histogram should be displayed on x and y axis
xnamevisu (character) – x axis title
ynamevisu (character) – y axis title
colnamevisu (character) – color bar title
adapt.visu (logical) – adapt margins
- Returns:
plot to display
- Return type:
plotly plot
quantitativeExploration.R
source("modules/shared/dynamicSelect.R", local = TRUE)
UI and Server functions
- quantitativeExploration.ui(id)
Populates the quantitative exploration panel
- Parameters:
id (character) – namespace of the module
Main reactives:
ui.cor: tab that displays correlations plot
ui.hsicdcor: tab that displays generalized correlations plot
ui.download: tab that contains buttons to download results
- quantitativeExploration.server(input, output, session, DOE, window.dimension, settings)
- Parameters:
input (list-like-object) – stores the widgets’ values.
output (list-like-object) – stores the instructions to build R objects in the app.
session (object) – environment that can be used to access information and functionality related to the session.
DOE (object) – stores the point values and the DOE information (e.g. bounds…)
window.dimension (object) – dimensions of the window
settings (list-like-object) – variables specified in settingsDOE.R
Main reactives:
Correlation tab
choicesXcor: list of the input variables
choicesYcor: list of the output variables
output$ui.cor: displays correlation plot
output$plot.correl: builds correlation plot
output$scatterplotCOR: builds scatter plot
Generalized Correlation tab
xnamehsicdcor: list of the input variables
ynamehsicdcor: list of the output variables
output$ui.hsicdcor: defines UI layout
output$plot.hsicdcor: displays correlation plot with computed DCOR
output$boxplotDCOR: displays boxplot with computed DCOR
Download tab
output$ui.download: defines UI layout
output$downloadCOR: download correlations in a CSV file
output$downloadDCOR: download distance correlations in a CSV file
Main functions
Secondary functions
- callback(r)
Reports progress of a task. Calls R Shiny incProgress
- Parameters:
r (numeric) – rth iteration
Define Calibration
defineCalibration.R
source("modules/menuImport/calibration/importExperimentalData.R", local = TRUE)
source("modules/menuImport/calibration/defineObjective.R", local = TRUE)
UI and Server functions
- defineCalibration.ui(id)
displays graphical components for the calibration process
- Parameters:
id (character) – namespace of the module
- defineCalibration.server(input, output, session, DOE, settings)
- Parameters:
input (list-like-object) – stores the widgets’ values.
output (list-like-object) – stores the instructions to build R objects in the app.
session (object) – environment that can be used to access information and functionality related to the session.
DOE (list) – stores the input point values and the input DOE information (e.g. bounds…)
settings (list-like-object) – variables specified in settingsDOE.R
Main reactives:
calibDOE: contains the calibration definition (experimental data, standard deviations, weigths) and objective function values
defineObjective.R
UI and Server functions
- defineObjective.ui(id)
displays graphical components for the definition of data weights
- Parameters:
id (character) – namespace of the module
- defineObjective.server(input, output, session, DOE, xpData, settings)
- Parameters:
input (list-like-object) – stores the widgets’ values.
output (list-like-object) – stores the instructions to build R objects in the app.
session (object) – environment that can be used to access information and functionality related to the session.
DOE (list) – stores the input point values and the input DOE information (e.g. bounds…)
xpData (list) – contains experimental data and standard deviations
settings (list-like-object) – variables specified in settingsDOE.R
Main reactives:
objFunc: contains the calibration definition (weights, normalization type) and objective function values
importDiscretization.R
UI and Server functions
- importDiscretization.ui(id)
This function displays a button that calls a modal window in order to import functional outputs discretization
- Parameters:
id (character) – namespace of the module
- importDiscretization.server(input, output, session, DOE)
- Parameters:
input (list-like-object) – stores the widgets’ values.
output (list-like-object) – stores the instructions to build R objects in the app.
session (object) – environment that can be used to access information and functionality related to the session.
DOE (list) – stores the input point values and the input DOE information (e.g. bounds…)
Main reactives:
importDiscF: contains discretization for functional outputs
importExperimentalData.R
UI and Server functions
- importExperimentalData.ui(id)
displays graphical components in order to import experimental data and standard deviations
- Parameters:
id (character) – namespace of the module
- importExperimentalData.server(input, output, session, DOE, settings)
- Parameters:
input (list-like-object) – stores the widgets’ values.
output (list-like-object) – stores the instructions to build R objects in the app.
session (object) – environment that can be used to access information and functionality related to the session.
DOE (list) – stores the input point values and the input DOE information (e.g. bounds…)
settings (list-like-object) – variables specified in settingsDOE.R
Main reactives:
xpData: contains experimental data and standard deviations
Main functions
- checkXPdata(data, DOE, ynames)
Check validity of imported experimental data
- Parameters:
data (data.frame) – contains imported DOE
DOE (list) – contains the input point values and the input DOE information (e.g. bounds…)
ynames (list) – list of the output names in the imported DOE
- Returns:
validity information about imported data
- Return type:
list